Discounting drift
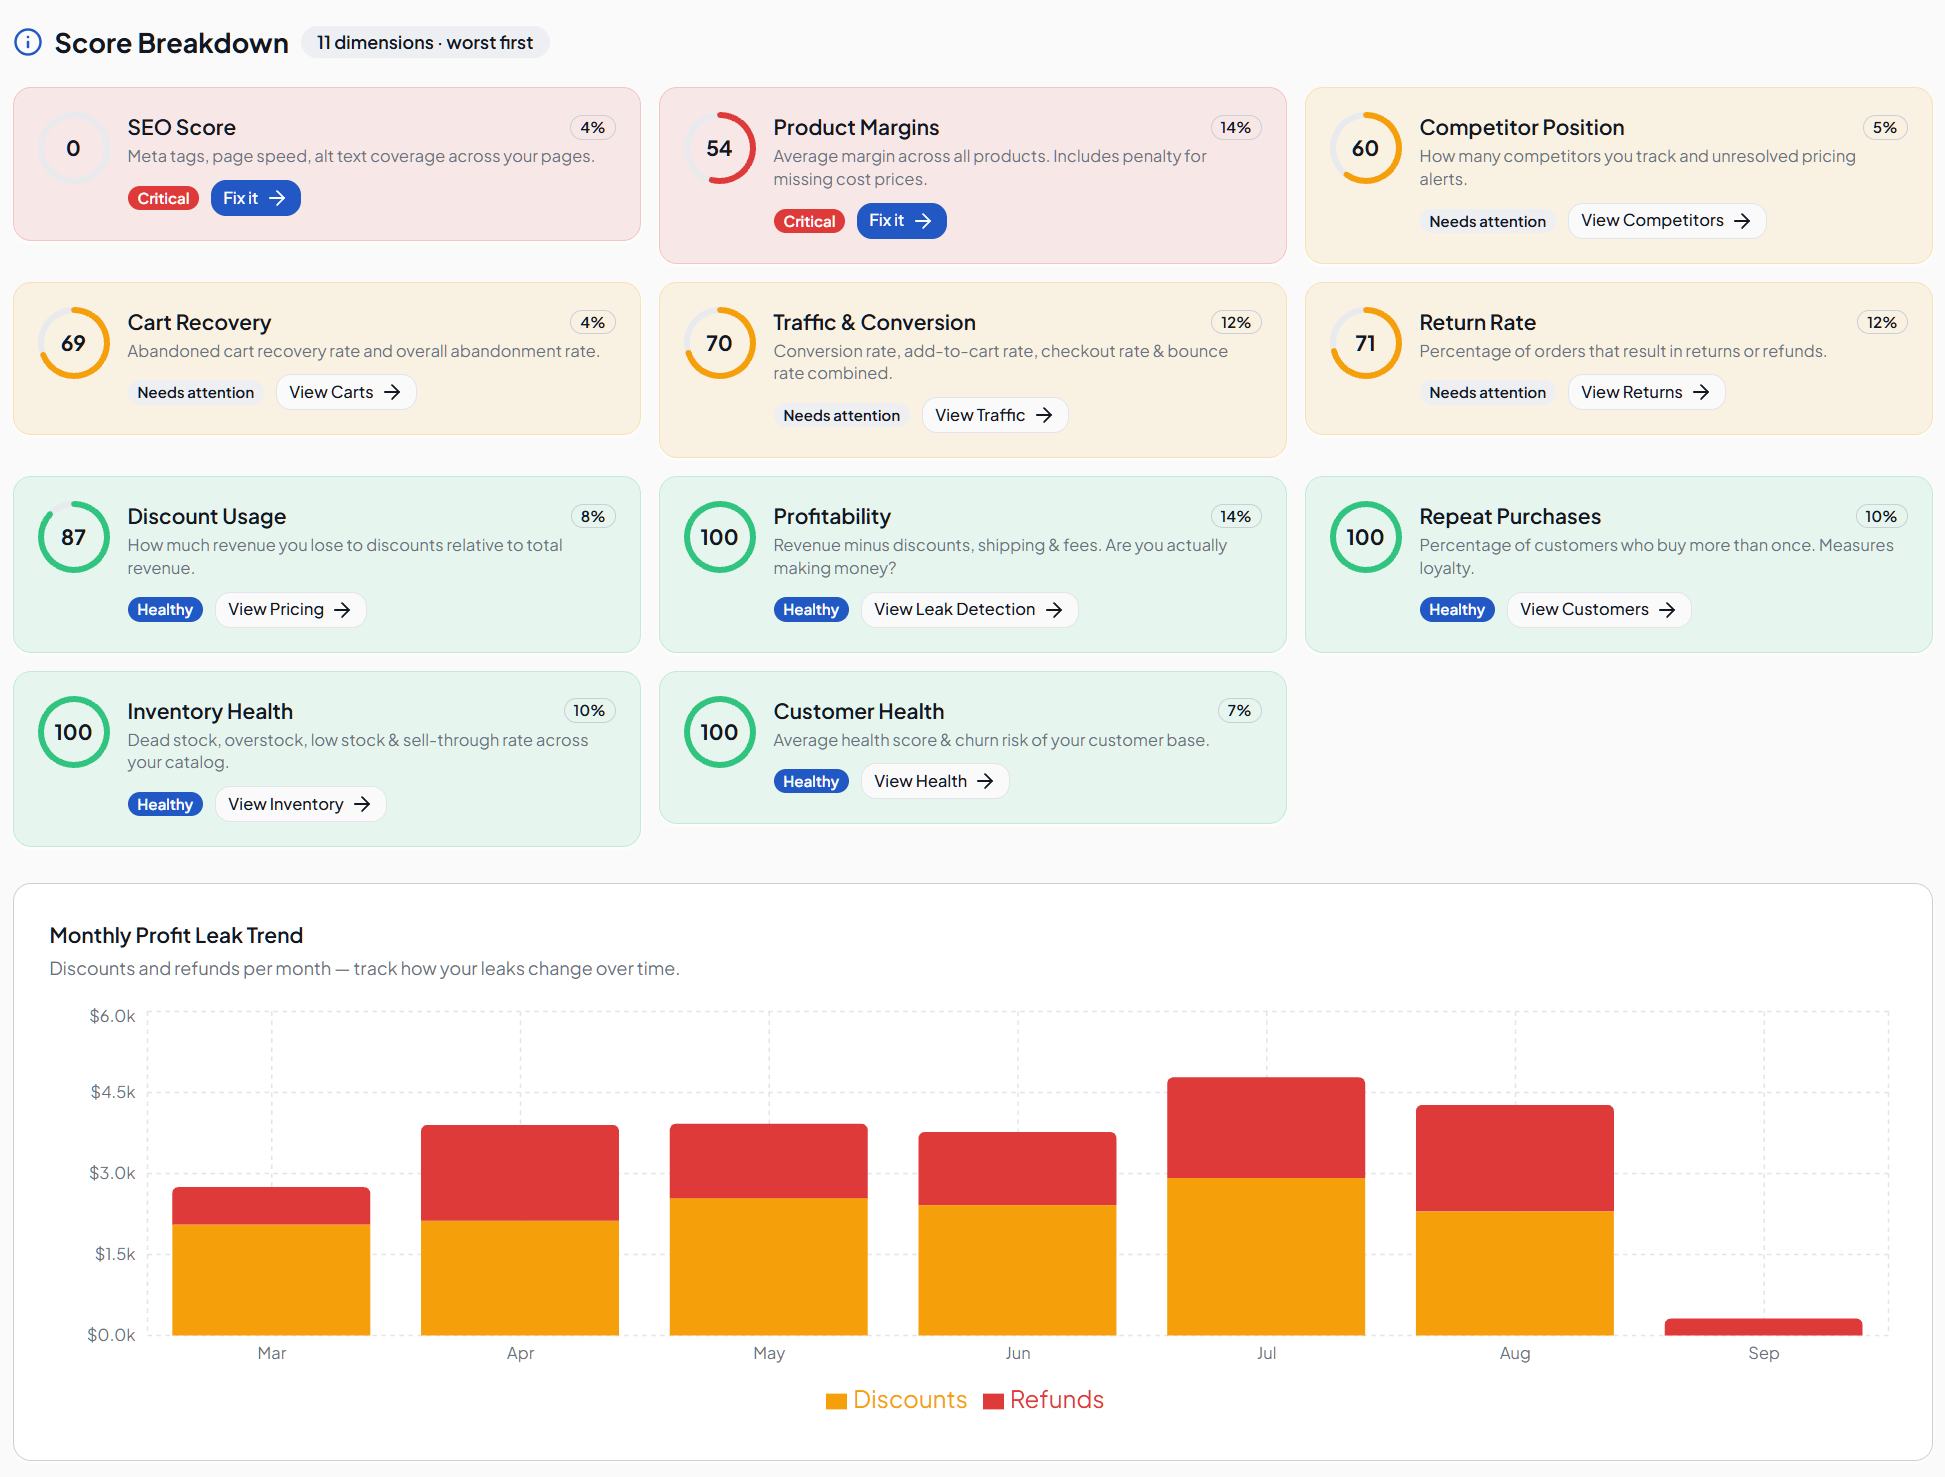
Automatic and stacked discounts push effective price below your cost-plus target. Track discount as a percentage of gross revenue per SKU, not per campaign.
A practical guide for Shopify and WooCommerce operators. What each margin actually measures, how to benchmark your own numbers, and the specific leaks that erode margin between the sale and the bank account.
01 — Definitions
“Profit margin” is not one number. Each variant answers a different question, and stores get into trouble when they manage the business on the most flattering one.
| Margin | Formula | Question it answers |
|---|---|---|
| Gross margin | (Revenue − COGS) ÷ Revenue | Is your pricing right versus product cost? |
| Contribution margin | (Revenue − COGS − variable costs) ÷ Revenue | Does this order still make money after fees, shipping, returns and ads? |
| Net margin | Net profit ÷ Revenue | What the business actually keeps after all operating costs. |
| Blended margin | Total gross profit ÷ Total revenue | Portfolio view — hides the loss-making SKUs, so never use it alone. |
02 — Calculation
Work per order, then aggregate. Start from what the customer actually paid, not the list price.
Gross margin % = (Revenue − COGS) / Revenue × 100
Contribution margin % = (Revenue − COGS − Variable costs) / Revenue × 100
Net margin % = Net profit / Revenue × 100
A worked example: a €60 order with €24 COGS has a 60% gross margin. Add €4.50 payment and platform fees, €6 shipping, €1.20 packaging and a 12% return rate costing €7.20 on average, and contribution margin drops to roughly 29% — before a single euro of advertising.
03 — Benchmarking
Published category averages vary widely by source, basket size and market, so they make a poor operating target. Four internal comparisons are more useful:
04 — Margin leaks
Automatic and stacked discounts push effective price below your cost-plus target. Track discount as a percentage of gross revenue per SKU, not per campaign.
A return costs the item margin plus outbound shipping, return shipping, handling and often the resale value. High-return variants can be net negative even at full price.
Free-shipping thresholds set below your true blended shipping cost quietly convert your best-converting offer into your biggest margin leak.
Supplier prices and freight move; product costs in the store often do not. Margins are calculated against stale costs for months.
Gateway, currency conversion and app fees are a fixed percentage tax on every order — material on low-ticket, high-volume catalogues.
When customer acquisition cost exceeds first-order contribution margin, more traffic makes the loss larger, not smaller.
05 — Improvement
Load real COGS, freight and per-order variable costs. Every margin number downstream is only as good as this input.
Rank SKUs by contribution margin in currency, not percentage. The tail of negative-margin SKUs is where the money goes.
Set price floors that cover COGS, fees, shipping and the expected return rate of that specific variant.
Set discount ceilings per margin band and align free-shipping thresholds with real blended shipping cost.
Fix sizing, imagery and description issues on the specific variants that drive the return volume.
Margins erode continuously. Treat margin review as a recurring operating routine, not a one-off audit.
Do it automatically
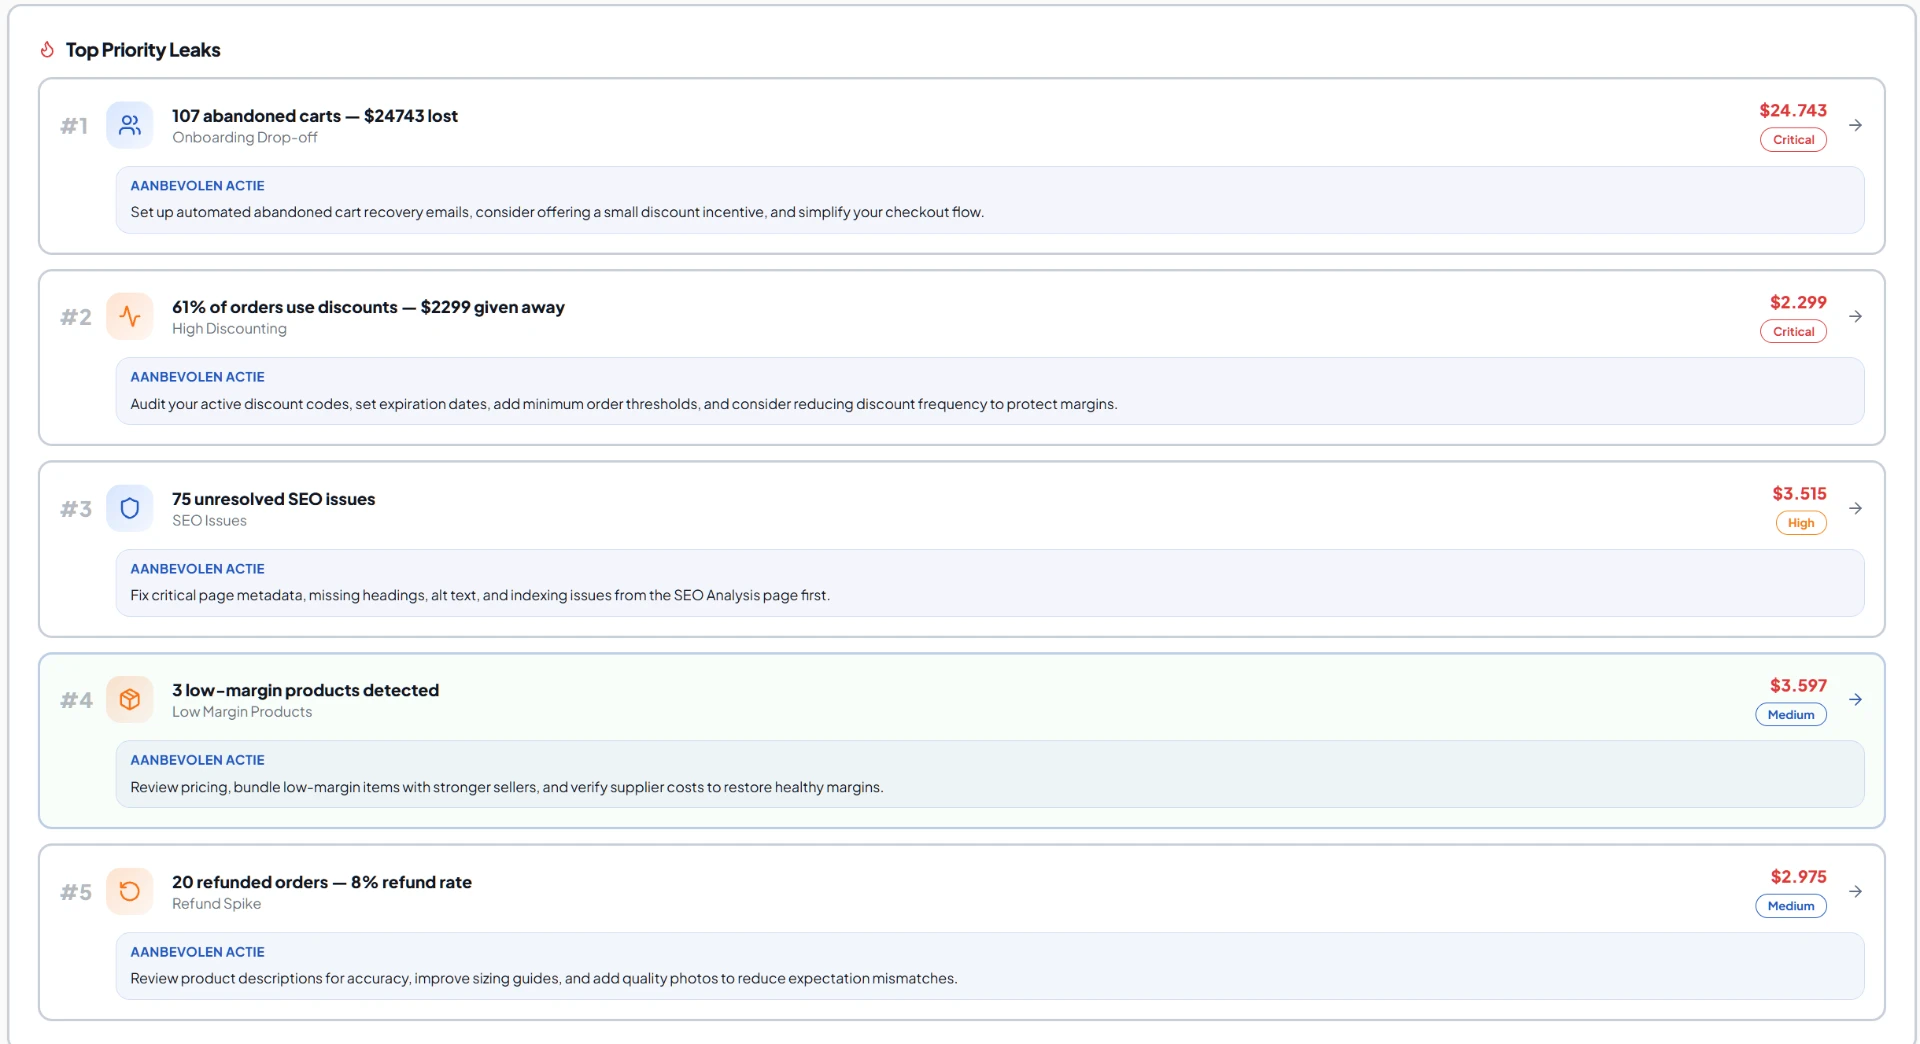
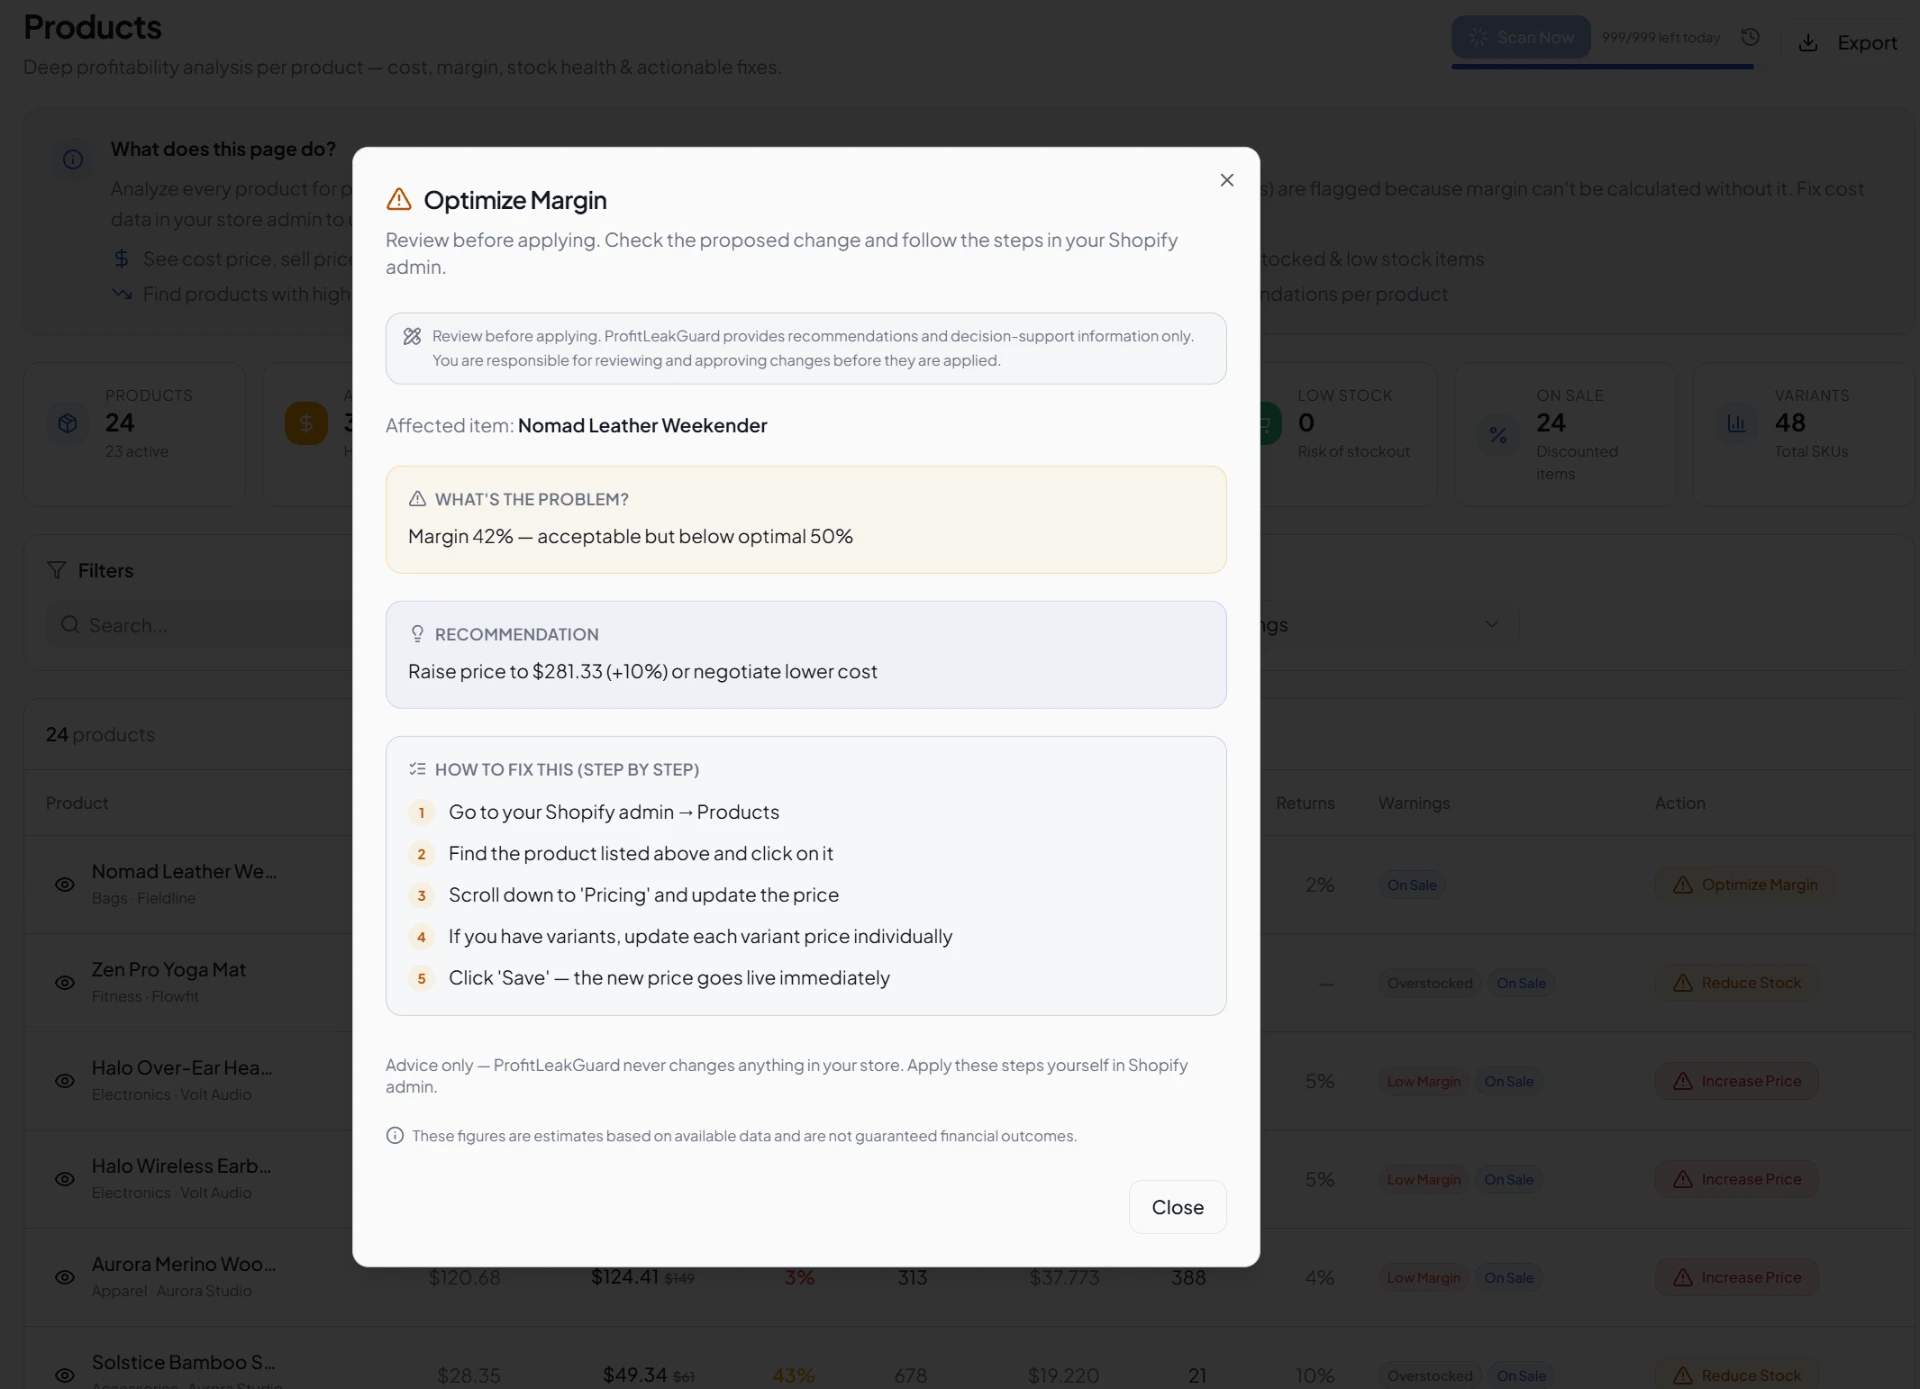
Connect Shopify or WooCommerce and it calculates margin per product, order and customer segment, detects the leaks above, ranks them by monthly money lost, and tells you what to do about each one.
Enter your email and secure your launch discount.
Free to join. No payment required. One email at launch. No obligation to buy.
FAQ
It depends on category and channel. Most online retailers work toward a gross margin high enough to absorb fulfilment, returns, discounts and paid acquisition and still leave a positive net margin. Rather than chasing a single benchmark number, compare your own margin over time and per product — a category-average figure hides the SKUs that are actually losing money.
Gross margin = (revenue − cost of goods sold) ÷ revenue × 100. Contribution margin subtracts variable costs such as payment fees, shipping, packaging, returns and ad spend. Net margin subtracts all operating costs as well. Calculate all three: a healthy gross margin can still hide a negative contribution margin.
Usually because growth is bought with margin: heavier discounting, higher paid acquisition cost, free shipping thresholds and rising return rates. Each of these is invisible in a revenue dashboard because they never appear as a line item you look at.
Yes. ProfitLeakGuard connects to Shopify and WooCommerce and reads orders, products, costs, discounts and returns to calculate margin per product, per order and per customer segment.
Nothing. Joining is free, no payment is required, and there is no obligation to buy. You get one email when ProfitLeakGuard opens, plus 50% off your first month.